| Concept | Description |
|---|---|
| The Business Analytics Cycle | |
| What the Cycle Is | A structured, repeatable process for turning a business question into a data-driven decision and then monitoring its impact. |
| The Ten Stages | Identify the problem, collect data, prepare data, explore (EDA), model, validate, generate insight, decide, implement, and monitor/feedback. |
11 The Business Analytics Cycle
The business analytics cycle is a structured approach to solving business problems through data-driven decision-making. Systematically gathering, processing, analyzing, and acting on data to uncover insight that supports informed decisions.
11.1 Stages of the Cycle
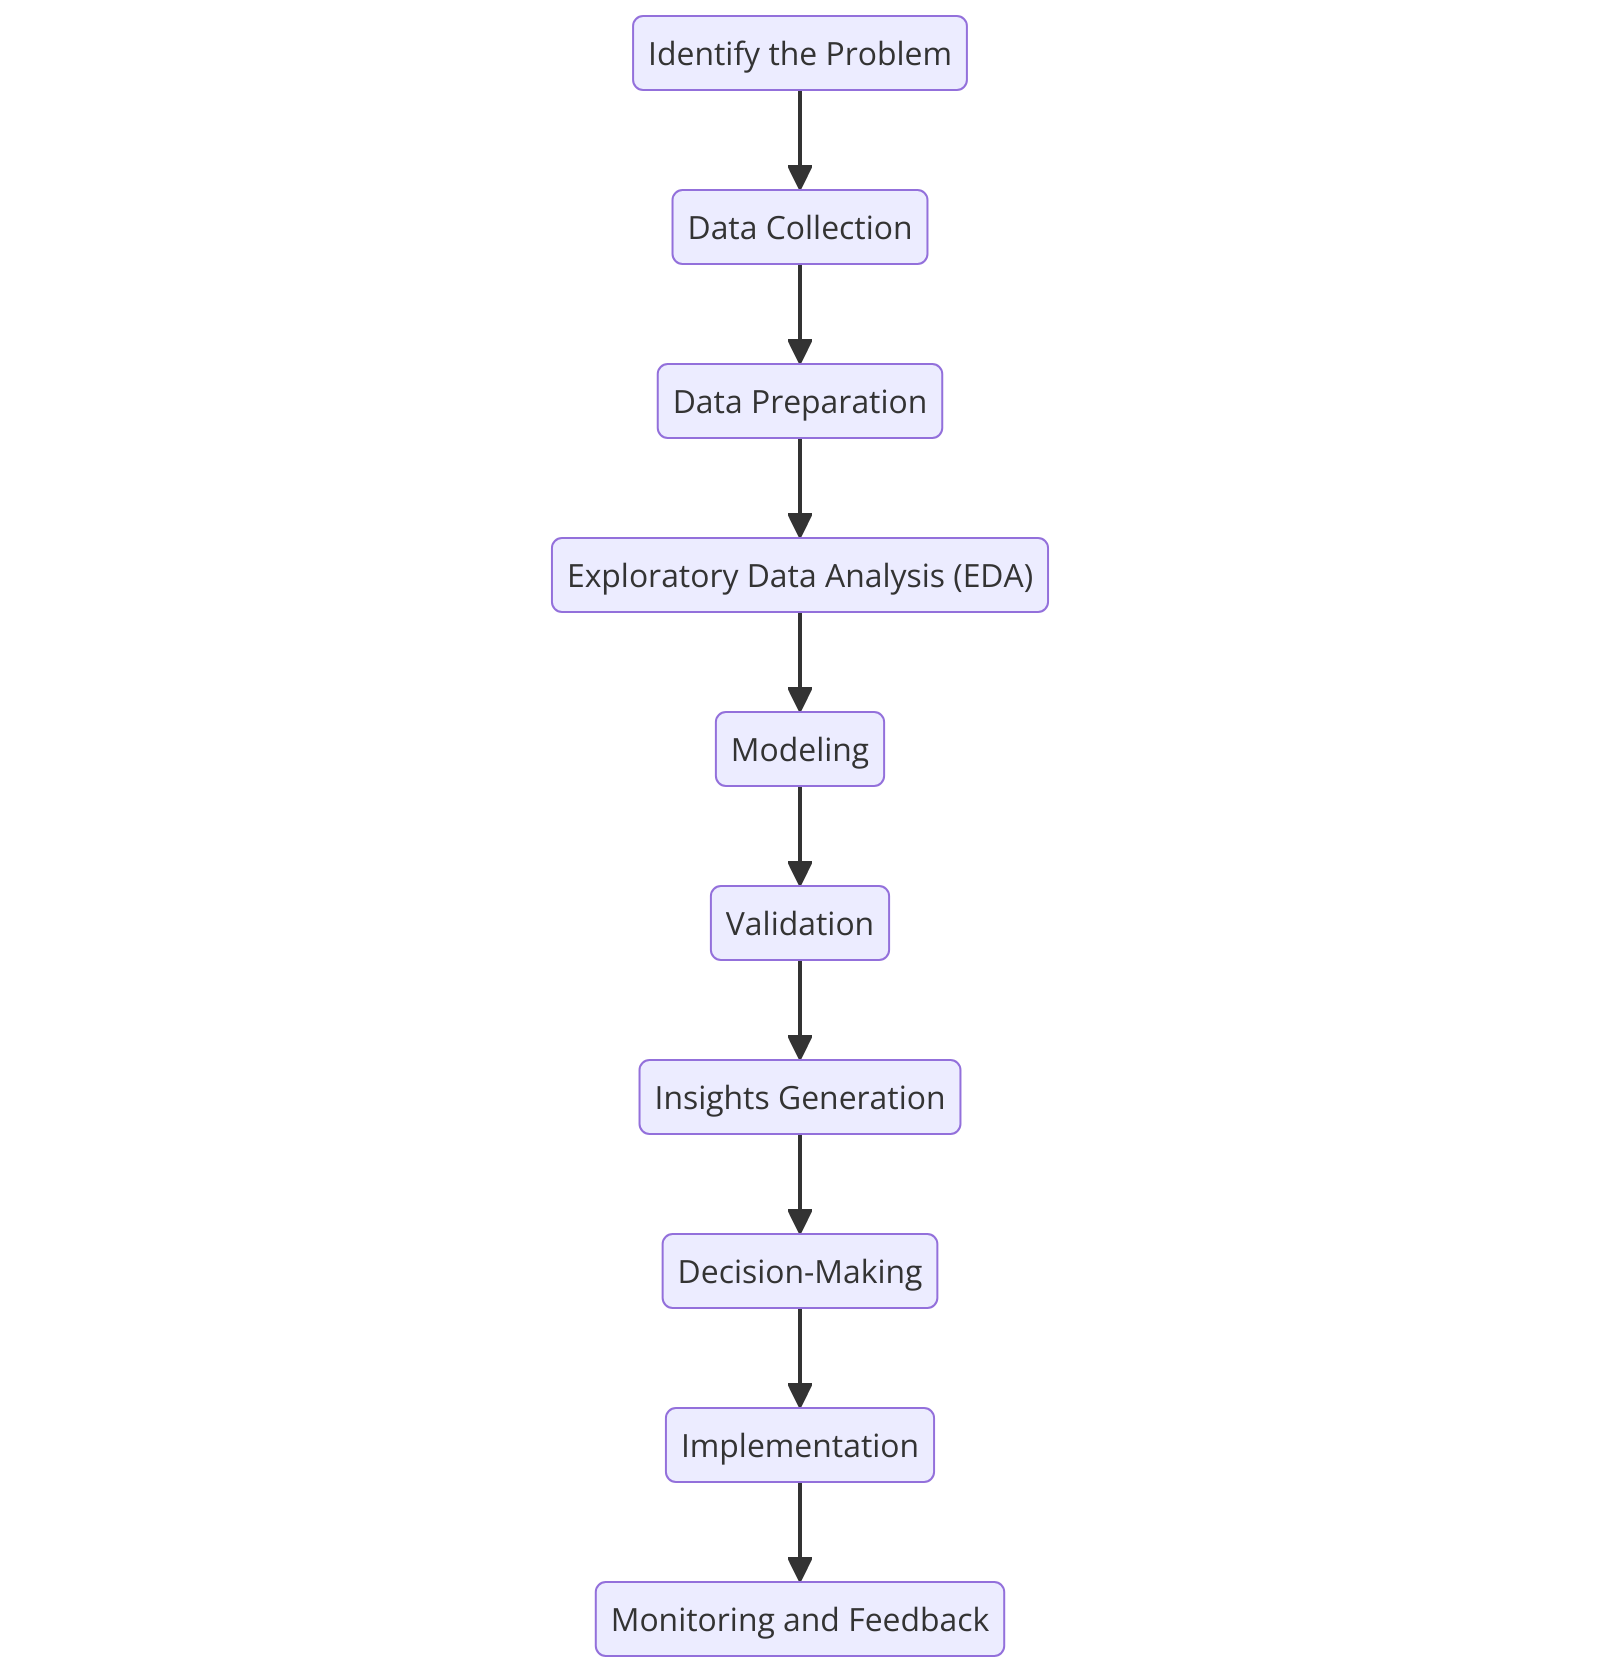
- Identify the problem. Clearly define the business question. Example: what factors are driving lower-than-expected yield in a particular region this season?
- Data collection. Gather relevant data from databases, surveys, IoT devices, or third-party providers. Example: soil quality, rainfall, input application, and market-price data.
- Data preparation. Clean and preprocess: remove inconsistencies, handle missing values, standardize formats, transform variables, and select relevant features.
- Exploratory data analysis (EDA). Uncover initial patterns and relationships using tools such as R, Python, Tableau, or Power BI. Example: analyzing seasonal trends in yield across the affected fields.
- Modeling. Apply statistical models and machine-learning algorithms: descriptive models to understand what happened, predictive models to forecast what’s next, prescriptive models to recommend action. Example: regression to predict yield from input variables, or clustering to group fields by risk profile.
- Validation. Assess accuracy and reliability with held-out test data and techniques such as cross-validation, using metrics like RMSE, MAE, or classification accuracy.
- Insight generation. Translate model results into actionable insight, dashboards, and reports. Example: a recommendation on optimal fertilizer application for the affected fields.
- Decision-making. Use the insight to inform strategic and operational choices. Example: adjusting the input plan for next season’s planting.
- Implementation. Put the decision into action. Example: rolling out an automated irrigation schedule based on the model’s recommendation.
- Monitoring and feedback. Track the impact of the decision and refine the analytics process as new data arrives. Example: tracking whether the revised fertilizer plan actually closed the yield gap, and updating the model with the new season’s results.
This ten-stage cycle is the thread running through the rest of this book: each later chapter (from R fundamentals through descriptive and inferential statistics to supervised and unsupervised learning) supplies the tools for one or more of these stages.