
It’s late afternoon. The kettle is quieter now. The fan turns slowly. Vijay has his thirty-day notebook open and has spent the last hour adding columns. He has four columns this time, not one:
Tea type — masala, ginger, plain, lemon Satisfaction —
1to5stars Time of day —8,10,13,16(the clock hour the customer arrived) Bill amount — in rupees
He has, in a moment of dutiful spreadsheet enthusiasm, asked the calculator for the average of each column.
Tea type came back as nonsense — the spreadsheet refused. Fine.
Satisfaction came back as 3.4. He stared at it. Three-point-four stars. What does that even mean? Halfway between fair and good?
Time of day came back as 12.5. Twelve-thirty PM on average. That feels… fine? But is it?
Bill amount came back as 47.8 rupees. That feels honest.
He mutters, “Why does the same operation work cleanly on some columns, awkwardly on others, and not at all on the rest?”
The awning rustles. Four people walk in.
The four siblings
They are clearly siblings. They walk in single file. The eldest sets down a small basket of name-cards on the counter. The second sets down three rosette ribbons marked 1, 2, 3. The third holds a small thermometer with a red-mercury bulb. The youngest, the most confident, sets down a small kitchen scale with a needle dial and a prominent 0 mark.
The eldest speaks. “We are the four levels of measurement. Nominal. Ordinal. Interval. Ratio. A man named Stanley Stevens invented this typology in 1946, in a single influential paper, and it has been the way people sort their data ever since. Each of us inherits the powers of the one above and adds one more property. Climb the ladder.”
She points behind Vijay. There is now a wooden ladder leaning against the back wall, four rungs, each capped in a different colour. The bottom rung is chalked Nominal, then Ordinal, then Interval, then Ratio at the top.
Vijay turns and looks up.
Nominal speaks first
She lifts the basket. Inside are four small cards: masala, ginger, plain, lemon.
She says, “I am Nominal. I am the lowest rung. I am labels only. I have no order. Masala is not greater than ginger. Plain is not less than lemon. They are just different categories.”
Vijay frowns. “So when I asked the calculator for the average of my tea-type column…”
“It refused. Correctly. The mean of masala and ginger is meaningless. There is no number to add. The only middle measure I support is the mode — the most frequent category. Plain showed up the most often this month? Then plain is the mode. That’s it.”
She pauses, then adds, “You can also count me. How many masalas did I sell? That’s a count, and counts are valid for any level. But arithmetic on the labels themselves — sums, means, ratios — none of that. I am too humble for that.”
Ordinal speaks
The second sibling steps forward and lifts her three ribbons. Gold 1, silver 2, bronze 3.
She says, “I am Ordinal. I add order to my elder sister’s labels. Now you can rank things. Excellent is better than good. Good is better than fair. Five stars beat four stars. Your satisfaction column is me.”
Vijay says, “So I can take its average?”
She winces. “Officially? No. Unofficially? You’re going to do it anyway and I’ll pretend I didn’t see. Here’s the problem. I have order — but I don’t have equal gaps. The gap from poor to fair is not necessarily the same as from good to excellent. The gap from 1 star to 2 stars may be a chasm in your customers’ minds, but the gap from 4 to 5 may be a hair. So adding my values and dividing — taking the mean — is mathematically suspect, because addition pretends the gaps are equal when they aren’t.”
She continues, “What I do support is the median. The middle-ranked value. If you ranked all 30 days from worst-rated to best-rated and pulled out the middle one, that’s a meaningful number. Mode also still works. But mean — be careful. Most of the world averages Likert ratings every day and gets away with it because the bias is small in practice. The textbooks frown.”
Vijay nods slowly. “So 3.4 stars is… approximately fine, but not technically clean.”
“Approximately fine. Not technically clean. Yes.”
Interval speaks
The third sibling lifts his thermometer. The mercury sits at half-full. The tube is marked °C.
He says, “I am Interval. I add equal gaps to my sister’s order. The difference between 20°C and 21°C is exactly the same as the difference between 30°C and 31°C. One degree is one degree, anywhere on the scale. So you can take means. You can compute standard deviations. You can run a t-test on me. All the arithmetic of differences is fine.”
Vijay says, “So my time-of-day column — 8, 10, 13, 16 — is you?”
“Yes. Clock time is interval. The gap from 8 AM to 10 AM is the same as from 13 to 15. Two hours is two hours. So the average arrival time, 12.5, is meaningful — it tells you the centre of your customer-arrival distribution.”
He pauses. “But there is one thing I cannot do. I have no true zero. Zero degrees Celsius is not no temperature — it is just where water freezes, by convention. Zero hours is not no time — it is midnight. So I cannot say twice as hot or twice as late. 20°C is not twice as warm as 10°C. 4 PM is not twice as late as 2 PM. Differences yes. Ratios no.”
He taps the thermometer. “If you ever want to say X is twice as much as Y — you need to climb to my younger sibling.”
Ratio speaks
The youngest steps up. He sets the kitchen scale on the counter. The dial reads zero. The big 0 is prominent. The needle quivers.
He says, “I am Ratio. I have everything: labels, order, equal gaps, and a true zero. Zero grams of sugar means no sugar. Zero rupees means no money. Zero customers means no customers. Zero is not a convention for me — it is a real, meaningful absence.”
He continues, “Because of that one extra property, I support every statistic. Mode, median, mean, standard deviation, t-test, regression — all fine. And I support ratios. Twice as heavy, half the bill, three times as many customers — all sentences that only make sense when zero is a real anchor.”
Vijay points at his bill-amount column. “So this is you?”
“Yes. Bill amount is ratio. So is grams of sugar sold, number of cups poured, minutes spent at the counter, age in years, kilometres travelled. Anything where zero genuinely means none of the thing.”
He smiles. “I am the most powerful rung. But that does not mean every column should aspire to be me. Tea type is nominal because it should be nominal. Forcing it to be ratio would be a category error — pretending you can take ratios of categories. The right level is determined by what the variable is, not by your wish for more arithmetic.”
What just happened
Vijay sits down on the counter and looks back at his notebook. The four columns. Four levels.
He says, slowly, “So when I want to compute the average, I am implicitly assuming my column is at least interval level — equal gaps. If it isn’t, the average is technically meaningless and possibly misleading.”
The four siblings nod in unison.
“And if I want to say X is twice as much as Y, I need ratio level — true zero. Without a meaningful zero, doubling is undefined.”
Nominal smiles. “And if you want to say most common — me. Mode. Counts.”
Ordinal: “Ranks, medians, percentiles — me.”
Interval: “Means, standard deviations, t-tests — me. But no doubling.”
Ratio: “Everything. Including doubling.”
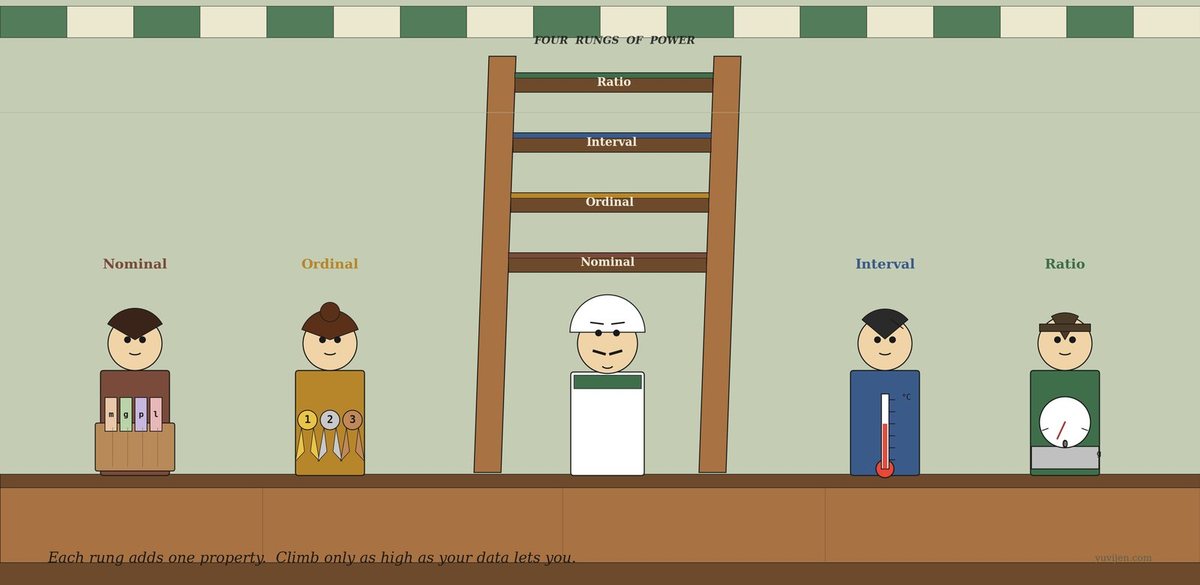
The same chat, in a chart

That picture is exactly the same conversation, drawn. The first panel is the rules — what each level lets you compute, with ✓ and — marks. The second panel is the ladder — climb up, each rung adds one property. The third panel is the four siblings in person, in case you forget which prop goes with which level.
One last warning before they leave
Ratio packs the kitchen scale back into a cloth bag. He looks at Vijay seriously.
“One thing. Modern software does not stop you from computing the mean of any column. Open the spreadsheet, point at the column of zodiac signs, hit average, and it will give you a number. The number will be garbage. The software is not your friend here. You have to know the level of the variable. You have to know whether the operation makes sense.”
Interval adds, “And the famous controversial case — the Likert scale. 1 to 5 ratings. Strictly ordinal. But practically, the world averages Likert ratings constantly — survey results, app store ratings, customer feedback dashboards — and treats them as if they were interval. The bias is usually small. The convention is widespread. The textbook is unhappy. The pragmatist shrugs. Just know which side you’re on, and don’t lecture anyone.”
Ordinal smiles. “And don’t forget that the unit of analysis matters. One Likert rating from one customer is ordinal. But the proportion of customers who gave 5 stars is a proportion — which is a ratio variable. You can change the level by changing what you’re measuring.”
Nominal, the eldest, has the last word. “Most of all — match the statistic to the level. Mode for me. Median for ordinal. Mean for interval. Ratios for ratio. The right tool for the right rung.”
Quick gut-check
Four columns. Which level is each?
- Customer’s t-shirt size: S, M, L, XL.
- Customer’s age in years: 24, 31, 47, 62.
- Customer’s zodiac sign: Aries, Taurus, Gemini, …
- IQ score: 90, 105, 120, 145.
1 is ordinal — there is order (S < M < L < XL) but the gaps aren’t precisely equal in any physical sense. Median yes, mean iffy. 2 is ratio — age has a true zero (birth), equal gaps (a year is a year), and ratios make sense (a 60-year-old is twice as old as a 30-year-old). 3 is nominal — categories with no order. Aries is not less than Taurus. Mode only. 4 is famously debated — most textbooks say interval (the gaps are designed to be equal, but the zero is conventional, not absolute — there is no such thing as “no IQ”). You can take means and t-test IQ scores, but you cannot say someone with IQ 140 is twice as smart as someone with IQ 70.
The answer to scenario 4 — interval, not ratio — is one of the most common quiet errors in social-science writing. People say “twice the IQ” all the time. The Stevens typology says: no, you can’t.
The bill
Vijay closed his notebook. Three of his four columns supported the average; one did not. He had been doing the right thing for bill amount and time of day. He had been doing a slightly suspect thing for satisfaction — but not a catastrophic thing, since Likert averaging is everyone’s small sin. And he had been correctly stopped by the spreadsheet from doing a meaningless thing for tea type.
He looked up at the ladder one more time. Four colour-capped rungs. Bottom to top: Nominal, Ordinal, Interval, Ratio.
The four siblings filed out under the awning, in the same order they had arrived. The fan ticked. The kettle hissed. Vijay turned to a new page and wrote, in the margin:
Don’t average a column that doesn’t admit averaging. Don’t double a number that has no true zero. Match the statistic to the rung.
For the math-curious
Nominal — categories. Permissible: counts, mode. Tests: chi-squared (on counts).
Ordinal — ordered categories. Permissible: above + median, percentile, rank correlation (Spearman, Kendall). Tests: Mann-Whitney, Wilcoxon, Kruskal-Wallis.
Interval — equal gaps, no true zero. Permissible: above + mean, standard deviation, Pearson correlation, regression. Tests: t-test, ANOVA, F-test.
Ratio — equal gaps, and true zero. Permissible: above + multiplication, division, geometric mean, coefficient of variation, log transforms. Tests: same as interval, plus anything that requires meaningful ratios.
The Stevens debate: Stanley Stevens published the typology in
1946. It has been challenged repeatedly — most famously by Frederic Lord (1953), who argued the typology was too restrictive, and by Paul Velleman & Leland Wilkinson (1993), who argued it confused the type of measurement with the type of variable. Practitioners today usually treat the four-level scheme as a useful default rather than a strict law — and reach for the more permissive operation when context allows.
Same data, four ladders. Climb only as high as the variable lets you.