All posts

Tag

#data-science

8 posts tagged with "data-science".

Stylised illustration of a tea stall — Vijay stands centre behind his counter looking up at a long chalked diagram on the back wall titled `degrees of freedom = n − 1 = 7`. Eight large round tokens are chalked in a row: seven of them have a `?` inside (free), the eighth has a small chalked padlock (spent). A brace under the seven free tokens reads `free to vary`; the eighth is labelled `spent`. On the far left a woman in warm orange holds a fan of blank slips each marked with a `?`. On the far right a man in graphite-blue holds a brass padlock with a small paper tag reading `x̄`.

Analytics

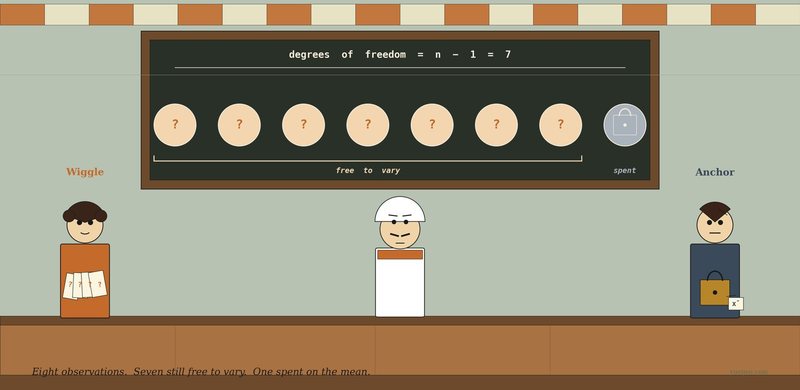
Degrees of Freedom Walks Into a Tea Stall

Vijay's calculator keeps using n − 1 instead of n. He doesn't know why. Two strangers — one with a fan of blank slips, one with a brass padlock — explain why every parameter you estimate costs you one of your data points.

Vijayakumar P 11 min read
Stylised illustration of a tea stall — Vijay stands centre behind his counter, looking up at a four-rung wooden ladder leaning against the back wall. Each rung is capped in a different colour and chalked with a level name (bottom-up: Nominal in earthy brown, Ordinal in gold, Interval in blue, Ratio in green). On the far left a sibling in earthy brown holds up a basket of name-cards labelled m / g / p / l. To the inner left a sibling in gold holds three rosette ribbons numbered 1, 2, 3. To the inner right a sibling in blue holds a small red-bulb thermometer marked °C. On the far right a sibling in green holds a kitchen scale with a 0 prominent on its dial.

Analytics

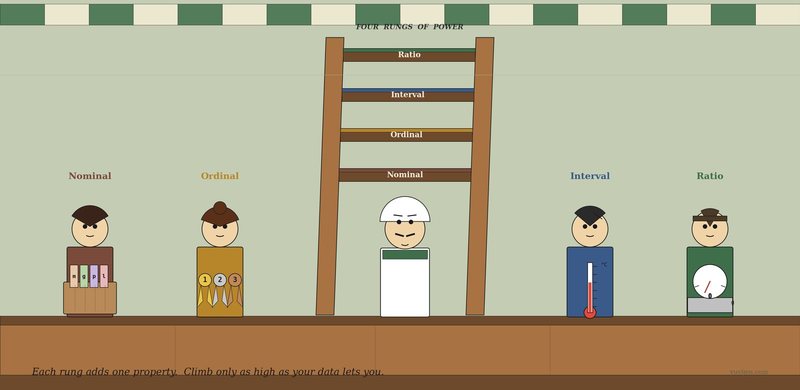
Nominal, Ordinal, Interval, Ratio Walk Into a Tea Stall

Vijay's notebook has four columns. He has tried to take the average of each. Three of them gave him an answer; only one of those answers was meaningful. Four siblings turn up, climb a ladder, and explain why.

Vijayakumar P 11 min read
Stylised illustration of a tea stall — Vijay stands centre behind his counter looking up at a wooden two-armed signpost mounted on the back wall. The left arm is grey, points left and reads `H₀ : NO CHANGE`. The right arm is warm orange, points right and reads `H₁ : SOMETHING CHANGED`. On the far left a calm man in plain grey holds up a small clipboard with `STATUS QUO` written across the top. On the far right a curly-haired man in warm orange holds up a magnifying glass.

Analytics

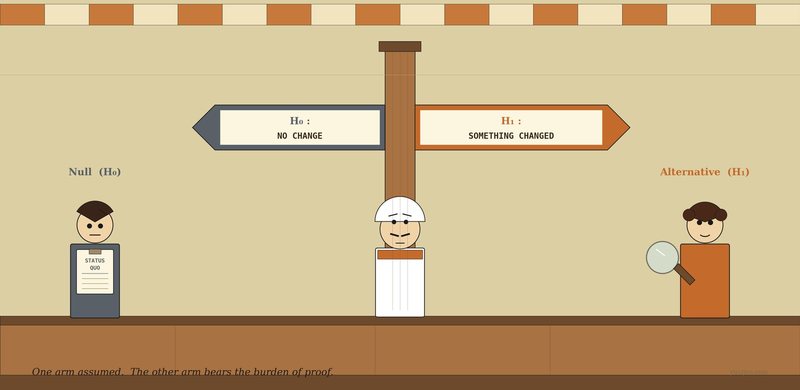
Null and Alternative Hypothesis Walk Into a Tea Stall

Vijay started serving fresh ginger biscuits this month. His daily mean rose from 87 to 91. Real effect or noise? Two strangers explain why every test is a courtroom — and which side is presumed innocent.

Vijayakumar P 11 min read
Stylised illustration of a tea stall — Vijay stands centre behind his counter looking up at a long chalked bell-curve diagram on the back wall titled `WHERE DOES α LIVE?`. The curve has shaded rejection regions: a heavy orange shade on the right tail, lighter teal shading on both tails, with critical values −1.96, 1.645, 1.96 chalked along the baseline. On the far left a focused man in warm orange holds a single arrow pointing right toward the orange right tail. On the far right a calm man in teal holds two arrows pointing in opposite directions.

Analytics

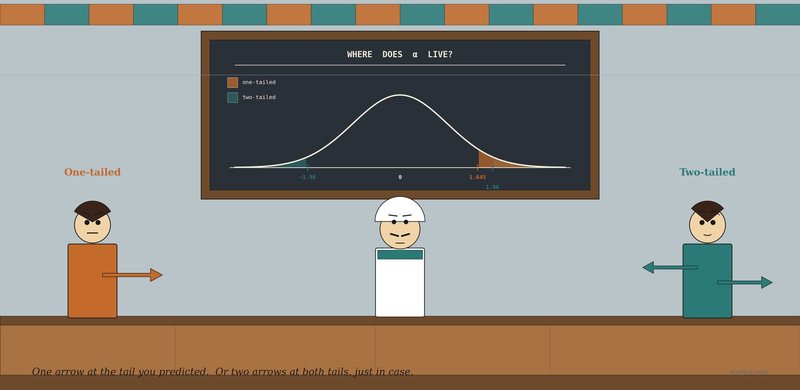
One-tailed and Two-tailed Tests Walk Into a Tea Stall

Vijay added cardamom to his tea. Mean rating rose from 3.8 to 4.0. He's about to run the t-test, and the software asks him a question he's never thought about — one-sided or two? Two strangers, one with a single arrow and one with two, explain why it matters.

Vijayakumar P 11 min read
Stylised illustration of a tea stall — Vijay stands behind his counter looking down at a paper card on the counter that asks 'is the cousin right?' with cousin's claim 100 on the left, his notebook's mean 87 on the right, and a big red question mark between them. A confident woman holding a printed σ = 14 card stands on the left; a careful man holding a fan of bell-curve cutouts and a small calculator showing −5.31 stands on the right.

Analytics

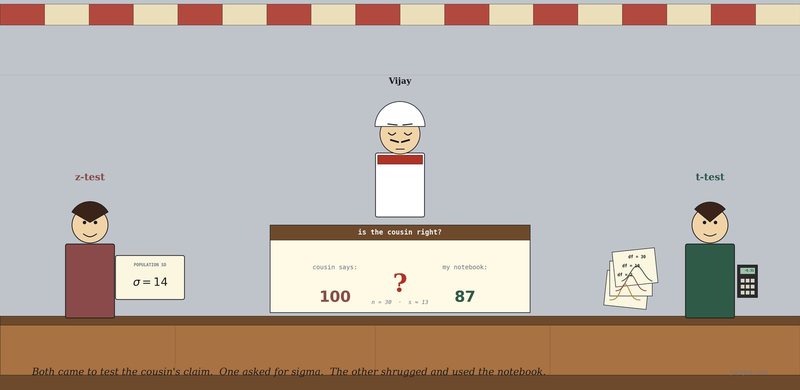
t-test and z-test Walk Into a Tea Stall

Vijay's cousin keeps claiming he should average 100 customers a day. The notebook says 87. Two strangers turn up to test it — one needs to know sigma, the other doesn't.

Vijayakumar P 9 min read
Stylised illustration of a tea stall — Vijay stands centre behind his counter looking up at a chalkboard 2x2 matrix mounted high on the back wall labelled Type I (top-left, red), Power (top-right, green), Correct (bottom-left, green), Type II (bottom-right, red). On the far left a confident woman in red holds a handbell mid-ring with BING! BING! sound waves. On the far right a calm man in navy wears a sleep mask, snoring Zzz, his own bell silent at his side.

Analytics

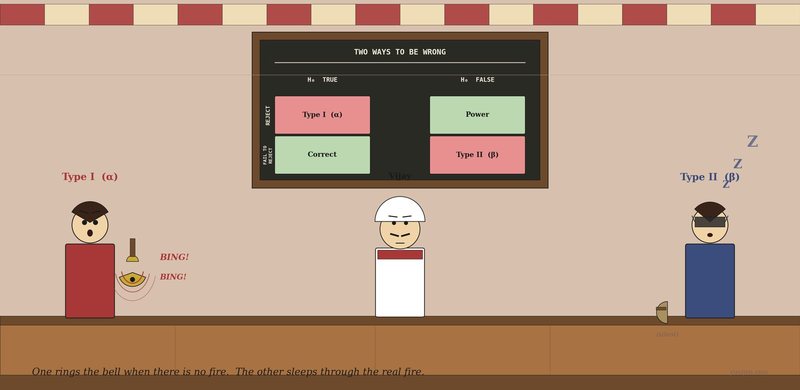
Type I and Type II Errors Walk Into a Tea Stall

Vijay's last 7 days dropped from his usual 87 to 75. The t-test rejects. Two strangers turn up — one rings a bell at every shadow, the other sleeps through real wolves — and explain what could go wrong with that verdict.

Vijayakumar P 10 min read
Stylised illustration of a tea stall owner standing behind his long wooden counter, holding an open notebook with a pen and quietly counting his inventory; a stack of tea glasses on the left of the counter, a plate piled with samosas on the right, a wall clock and a small jar shelf in the background.

Analytics

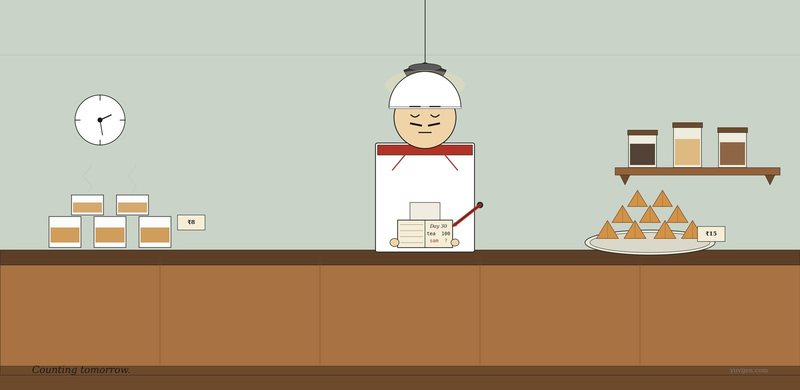
Correlation and Regression Walk Into the Same Tea Stall

Vijay the tea stall owner needs to know how many samosas to fry tomorrow. Correlation can describe his data, Regression can predict from it — and the difference is the whole story.

Vijayakumar P 6 min read
Stylised illustration of a roadside tea stall — two women on a long bench with cups of tea, one with shopping bags piled around her, the other calm and empty-handed; the tea stall owner pouring tea behind the counter.

Analytics

Covariance and Correlation Walk Into a Tea Stall

Vijay the tea stall owner has a question. Two old friends arrive with two different answers — same idea wearing different clothes.

Vijayakumar P 5 min read

Stay in the loop

Connect with Vijayakumar P on LinkedIn.

New posts, research notes, and HR-analytics tips — straight to your LinkedIn feed.

Connect on LinkedIn