
Analytics
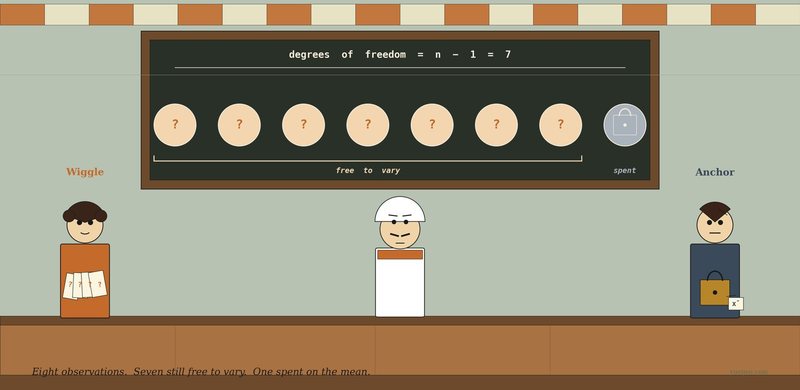
Degrees of Freedom Walks Into a Tea Stall
Vijay's calculator keeps using n − 1 instead of n. He doesn't know why. Two strangers — one with a fan of blank slips, one with a brass padlock — explain why every parameter you estimate costs you one of your data points.
Analytics
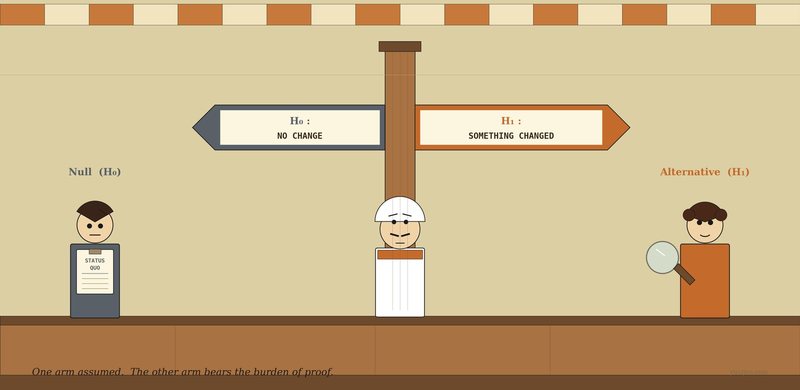
Null and Alternative Hypothesis Walk Into a Tea Stall
Vijay started serving fresh ginger biscuits this month. His daily mean rose from 87 to 91. Real effect or noise? Two strangers explain why every test is a courtroom — and which side is presumed innocent.
Analytics
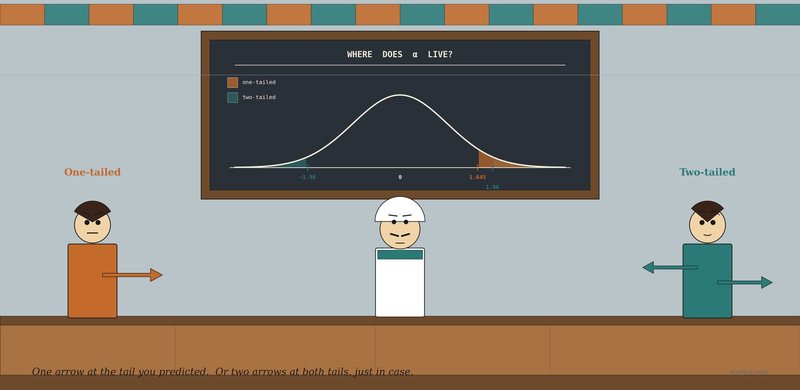
One-tailed and Two-tailed Tests Walk Into a Tea Stall
Vijay added cardamom to his tea. Mean rating rose from 3.8 to 4.0. He's about to run the t-test, and the software asks him a question he's never thought about — one-sided or two? Two strangers, one with a single arrow and one with two, explain why it matters.
Analytics
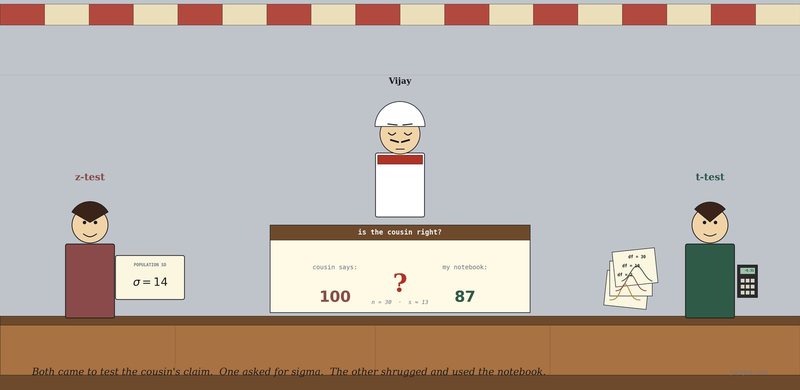
t-test and z-test Walk Into a Tea Stall
Vijay's cousin keeps claiming he should average 100 customers a day. The notebook says 87. Two strangers turn up to test it — one needs to know sigma, the other doesn't.
Analytics
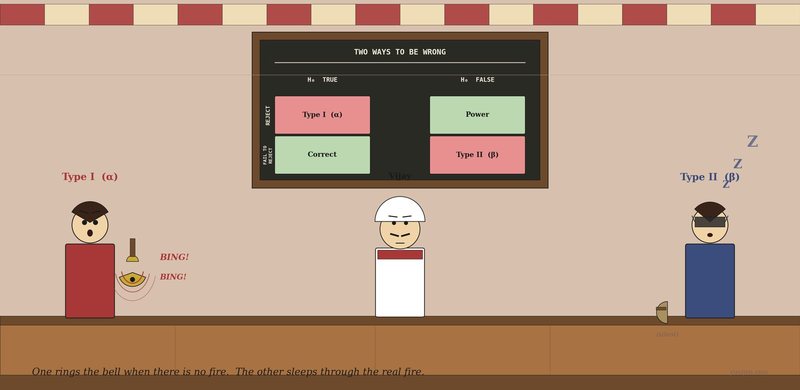
Type I and Type II Errors Walk Into a Tea Stall
Vijay's last 7 days dropped from his usual 87 to 75. The t-test rejects. Two strangers turn up — one rings a bell at every shadow, the other sleeps through real wolves — and explain what could go wrong with that verdict.
Stay in the loop
Connect with Vijayakumar P on LinkedIn.
New posts, research notes, and HR-analytics tips — straight to your LinkedIn feed.
Connect on LinkedIn