
The clock on the wall reads three. The kettle hisses. The fan turns, slowly, above. Vijay has his thirty-day notebook open on the counter — and beside it, a smaller piece of paper with just the last 7 days copied across.
The thirty-day average is 87. The last 7 days average 75. He has just run the t-test from last week’s lesson. It rejected. The drop is real. Not noise.
He is now staring at that verdict and not feeling certain at all. He mutters, “What if the test got it wrong? What if the drop is real but the test missed it? What if there’s no drop and the test imagined one?”
The awning rustles.
A woman steps in — bright red kurta, slightly imperious posture, a small brass handbell in her right hand. She rings it once on the way in — BING! — purely for effect. She introduces herself: “I am Type I error. I ring my bell when there is nothing to ring at. I see wolves where there are none. I cause false alarms.”
A man drifts in behind her — calm, navy shirt, a soft sleep mask pushed up on his forehead, his own little bell hanging silent at his side. He yawns. “I am Type II error. I sleep through real wolves. I miss the thing that is genuinely happening. I cause missed detections.”
Vijay puts down his pen and stares. “But the test already gave me an answer. It rejected. The drop is real. Why are you both here?”
Type I smiles, rings her bell once more — BING! — and says, “Because every test answer can be wrong in one of exactly two ways. Whichever side of the verdict you land on, one of us is the risk you took.”
The 2×2 on the back wall
Type I is already at the chalkboard mounted high on the back wall. She picks up the chalk and draws a clean 2x2 grid.
Across the top, in capitals: REALITY. Down the side: TEST SAYS.
She fills it in:
Top-left — Reality: nothing wrong. Test says: ALARM. That’s me. Type I. False alarm. Symbol: α.
Top-right — Reality: something IS wrong. Test says: ALARM. Correct catch. Symbol: 1 − β (call it Power).
Bottom-left — Reality: nothing wrong. Test says: nothing. Correct silence.
Bottom-right — Reality: something IS wrong. Test says: nothing. That’s him. Type II. Missed it. Symbol: β.
She circles the two red corners — top-left and bottom-right — and says, “These two are the only ways the test can be wrong. Pick one to fear more than the other. You don’t get to fear neither.”
Type II, from the corner, mumbles, “Most people fear her too much and forget about me.”
Type I tries first
Type I rings her bell three times — BING! BING! BING! — and says, “Imagine you set your test very strict. You only reject when you are very sure. You demand p < 0.001. What happens to me?”
Vijay says, “You… shrink. Right? Strict cutoffs mean fewer false alarms.”
“Exactly. I become rare. α drops.” She points her bell at Type II. “But look what happens to him.”
Type II, who has been pretending to nap, raises one eyelid. “I get fatter. Every real drop in your sales has to be enormous before your strict test will notice it. Small but real drops? I sleep right through them. β climbs.”
Vijay frowns. “So if I tighten up to avoid false alarms, I miss real problems.”
Type I nods. “And if you loosen up to catch real problems — p < 0.10 instead of p < 0.001 — I come roaring back. More false alarms. The two of us are on a see-saw. Push one side down, the other goes up. For a fixed sample size.”
She underlines that last bit on the board: for a fixed sample size.
Type II tries
Type II finally stands up, pushes his sleep mask onto his forehead properly, and walks over. “Let me show you the side everyone forgets.”
He picks up Vijay’s notebook, the small one, the seven-day one. “Your sample is seven days. That’s tiny. With seven data points and a true drop of, say, eight customers a day, my β is huge. Maybe 40%. Maybe more. That means: even if your sales really did drop, there’s a 4-in-10 chance your test would have shrugged and said no significant change.”
Vijay’s eyes widen. “But the test rejected. So… I’m fine?”
Type II raises a hand. “This time, yes. The drop was so big — 87 to 75, that’s 13.8% — that even my fat β couldn’t hide it. But if the drop had been only 87 to 83, with seven days? I would have missed it. You’d have closed the notebook, gone home, and the slow bleed would have continued.”
He yawns again. “I am the silent error. People only notice α because alarms are loud. Missed wolves are quiet.”
What just happened
Vijay finally pours himself a glass of tea — the first all afternoon — and looks back at the 2×2 on the chalkboard.
“So every time I run a test,” he says slowly, “I am picking how much of each of you I’m willing to tolerate.”
Both nod.
“And the only knob I get is α — the cutoff. 0.05, 0.01, whatever I decide before I run the test. β falls out of that choice, plus the sample size, plus how big the real effect actually is.”
Type I rings her bell, gently this time. “Yes. α you set directly. β you get whether you like it or not.”
Type II adds, “And if you want to lower both of us at the same time, the only honest way is more data. Bigger n. With more days in your notebook, the see-saw gets shorter — both ends come down.”
The same chat, in a chart

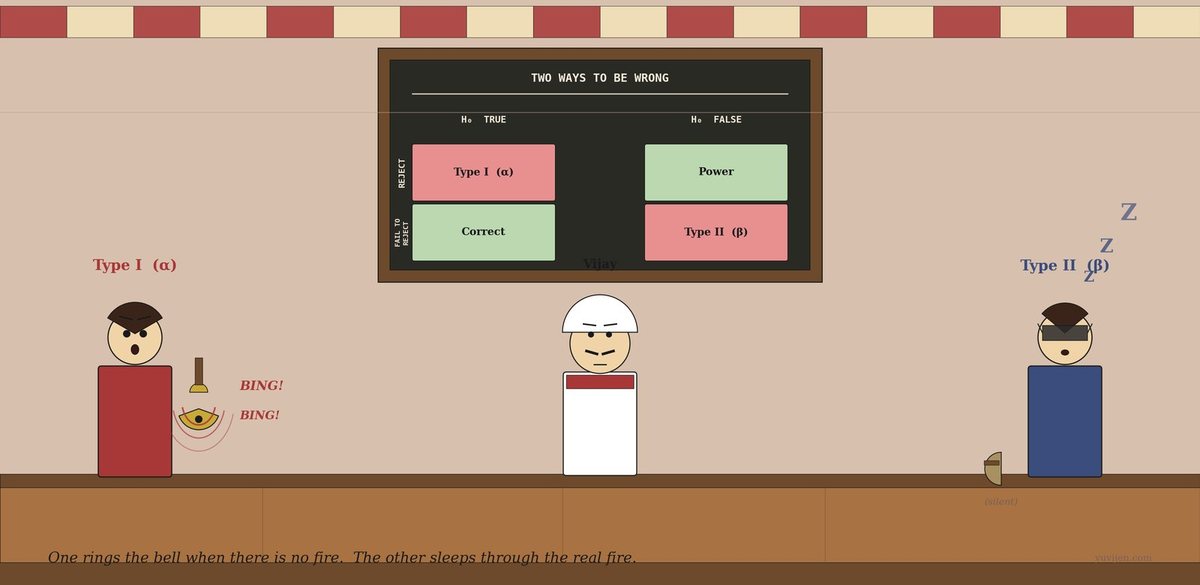
That picture is exactly the same conversation, drawn. The first panel is the matrix on the chalkboard — two ways to be right (green), two ways to be wrong (red). The second panel is the see-saw: at any fixed sample size, lowering α raises β. The lower curve — bigger n — sits well below the upper curve — small n. More data is the only way to push the whole curve down. The third panel is the two of them in costume, in case you forget which is which: bell-ringer for false alarms, sleeper for missed detections.
One last warning before they leave
Type II adjusts his sleep mask back over his eyes. “One thing, Vijay. People obsess over α — the famous 0.05. They almost never report β or its friend Power = 1 − β. But for any decision that matters — did the new menu actually help, did the festival actually slow business, did the cousin’s theory actually hold up — knowing how often you would have missed a real effect is just as important as knowing how often you’d have shouted at a fake one.”
Type I rings her bell one final time — BING! — softly. “And remember the asymmetry. α is set before the test. β depends on the truth you don’t know. Which is why power calculations — figuring out what sample size you’d need to keep β below, say, 20% if the real effect is at least this big — are done before you collect data, not after.”
Vijay says it back, slowly. “Set α to control false alarms. Calculate the sample size I’d need to keep β small enough. Don’t tighten α without thinking about what it does to β. And report power, not just p-values.”
Type II nods. “And don’t fear me less than her just because I’m quiet.”
Quick gut-check
Three scenarios. Which error is worse — Type I (false alarm) or Type II (missed detection)?
- A medical screening test for an aggressive but treatable cancer.
- A criminal trial where the defendant faces life imprisonment.
- A spam filter that decides whether to send an email to the junk folder.
Scenario 1: Type II is worse. A false alarm (Type I) leads to more tests and worry. A missed detection (Type II) lets the cancer grow untreated. Tune α loose; favour catching the disease. Scenario 2: Type I is worse. Convicting an innocent person (Type I) is, by long legal tradition, far worse than letting a guilty person go (Type II). Tune α extremely strict — “beyond reasonable doubt” is roughly α ≈ 0.01 or stricter. Scenario 3: Type I is worse for the user. Real email landing in junk (Type I, in spam-filter framing) is much more annoying than a junk email reaching the inbox (Type II). Spam filters are tuned conservative for this reason.
The point of the exercise is not the right answer. It’s that the right α depends on what each kind of error actually costs you. There is no universal 0.05.
The bill
Vijay closed his thirty-day notebook with a smaller smile than usual. The drop from 87 to 75 was real — the t-test had been right to reject. But the visit had reframed his question. He no longer felt that the test had given him a certain verdict. It had given him a verdict with a known false-alarm rate (α) and an unknown miss rate (β). The verdict was probably right. Probably was the honest word.
Type I tucked her handbell under her arm. Type II yawned, lowered his sleep mask, and walked into the afternoon without making a sound. The fan ticked. The kettle hissed. Vijay turned to a fresh page in his notebook and wrote, in the corner, the only sentence he wanted to remember from the visit:
Set α before the test. Worry about β after. Reduce both with more data.
For the math-curious
α =
P(reject H₀ | H₀ is true)= false-alarm rate = Type I error rate. You set this.β =
P(fail to reject H₀ | H₁ is true)= miss rate = Type II error rate. You don’t set this — it falls out of α, sample size n, and the true effect size.Power =
1 − β=P(reject H₀ | H₁ is true)= probability of catching a real effect.Three knobs, one constraint. For a fixed sample size n and a fixed true effect, lowering α raises β (and lowers power). The only way to lower both α and β is to increase n.
Power calculation (done before collecting data): given the smallest effect you’d care to detect and the α you’ve chosen, what n keeps power ≥ 0.80 (i.e. β ≤ 0.20)? Most rigorous studies — clinical trials, A/B tests at scale — answer this question first and then go collect that much data.
Same 2×2. Two different ways to be wrong. Pick which one you fear more, and tune accordingly.